
⚡️Business Automation Unlocked: Reports That Write Themselves

Weekly reports often start with good intentions and end with copy-paste fatigue. Data lives in dashboards, but the story still depends on someone stitching it together. This week is about closing that gap using AI to turn raw data into clear, consistent narratives your team can act on.
1️⃣ 🔧 Best practices for prompting
Structure your input before expecting insight. Tell AI what matters, not just what exists. When working with reports, clarity comes from framing the data and defining the output format.
Start by giving the AI clean data or a summarized table. Then explain the goal of the report. Is it performance tracking, risk detection, or executive updates?
Next, define the sections you want. For example, summary, key changes, risks, and recommendations. This keeps outputs consistent week to week.
Complexity level: Beginner
Common mistakes and fixes
| Mistake | Why it hurts | Quick fix |
|---|---|---|
| Pasting raw data without context | AI doesn’t know what matters | Explain the purpose of the report and audience |
| Asking for a generic summary | Output lacks insight | Request trends, anomalies, and recommendations |
| Changing format every time | Reports become inconsistent | Define a fixed structure for every run |
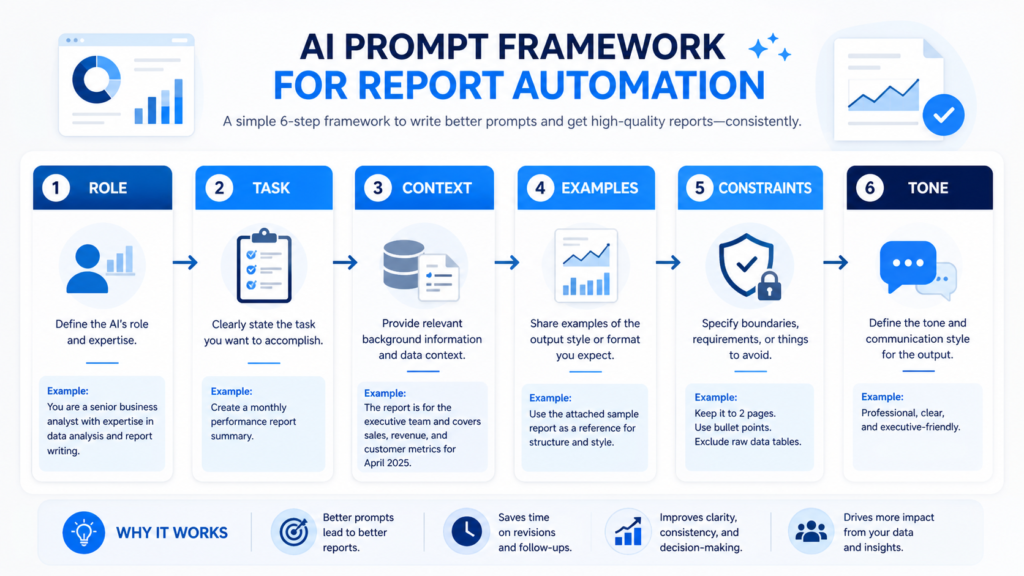
Here are practical prompts to try:
- “You are a data analyst. Turn this weekly sales table into a short executive report with trends, risks, and recommendations.”
- “You are an operations analyst. Identify any unusual changes in this data and explain them in simple terms.”
- “You are a manager assistant. Summarize this dashboard into three key insights and one action per insight.”
- “You are a personal finance assistant. Turn this expense list into a monthly summary with saving suggestions.”
2️⃣ 🤖 Featured tool deep dive
ChatGPT can transform structured or semi-structured data into readable narratives. It helps translate numbers into meaning, which is often the hardest part of reporting.
| Role | Use case | Input → output | Level |
|---|---|---|---|
| Data Analyst | Weekly KPI report | Spreadsheet → narrative summary | Beginner |
| Operations Manager | Performance tracking | Dashboard export → insights + actions | Beginner |
| Team Lead | Team productivity update | Task data → progress summary | Beginner |
| Finance Analyst | Budget review | Expense data → trends + recommendations | Intermediate |
The real benefit is consistency. Reports become easier to produce, easier to read, and easier to act on.
3️⃣ 🧩 What AI can do for you (by function)
| Function | Task | Input → output |
|---|---|---|
| Operations | Track performance | KPI data → weekly summary |
| Support | Monitor tickets | Ticket logs → issue trends |
| Admin | Create updates | Raw data → internal report |
| Marketing | Analyze campaigns | Metrics → insights + next steps |
| Sales | Review pipeline | CRM data → deal summary |
| Creative | Measure output | Project data → productivity insights |
| HR/L&D | Track engagement | Survey results → summary + actions |
4️⃣ 📆 Tips for everyday tasks
| Who it’s for | Tip (with one emoji) | Tiny prompt |
|---|---|---|
| Managers | Get quick insights 📊 | “Summarize this data into 3 key takeaways.” |
| Analysts | Spot anomalies 🔎 | “What looks unusual in this dataset?” |
| Team leads | Share updates ✉️ | “Turn this into a short team update.” |
| Anyone | Save time ⏱️ | “Rewrite this report in half the length with clear actions.” |
5️⃣ 🧭 Which tool to use & when — decision table
| Task | Tool | Why | Level |
|---|---|---|---|
| Generate report summaries | ChatGPT | Strong at turning data into narrative | Beginner |
| Store and organize data | Excel | Familiar and flexible | Beginner |
| Visualize metrics | Power BI | Clear dashboards for input | Beginner |
| Share reports | Microsoft Teams | Easy team communication | Beginner |
| Automate data flow | Zapier | Connects tools for automation | Intermediate |
| Schedule reporting workflows | Power Automate | Handles recurring processes | Intermediate |
6️⃣ 🧱 One AI myth holding businesses back
Some teams believe AI will replace the need for understanding data.
That leads to blind trust in outputs. AI can summarize patterns, but it doesn’t replace judgment.
For example, if a spike in sales appears, AI can highlight it. But only a human can confirm whether it’s due to a promotion, seasonality, or an error.
The truth is this, AI speeds up insight, but humans still validate meaning.
7️⃣ 💼 One costly C-level mistake (and a fix)
A frequent mistake is demanding more reports instead of better ones.
Leaders ask for more dashboards, more metrics, more detail. That often creates noise, not clarity.
A better approach:
- Define what decisions each report should support
- Standardize report structure across teams
- Use AI to generate consistent summaries
- Focus on insights, not volume
- Review outputs regularly and refine prompts
If a report doesn’t lead to action, it’s just information.
8️⃣ 🔭 What’s next
Next week, we’ll connect AI-generated reports directly into automated alerts so teams are notified when something actually needs attention.
Small prep step, export one recent report or dataset you use regularly.
9️⃣ ❓ Question of the day
When you read your last report, did it clearly tell you what to do next?
🔟 📣 Call to action
Take one recurring report and rewrite it using AI with a fixed structure. Compare the clarity and time saved.
⚡️Stay curious, stay sparky!

Dr. Alaa Alsarhan is a higher education leader and analytics expert specializing in assessment, learning outcomes, and data-informed decision-making. He is CEO & Co-Founder of Horizons Analytics, a consultancy advancing AI-powered assessment and strategic planning in education and business. Dr. Alsarhan has authored multiple publications, delivered national keynotes, and led innovative research on high-impact practices, student success, and AI in higher education. He is a founding member of the GenAI in Higher Education Assessment Community of Practice and a fellow with the NWCCU Mission Fulfillment and Sustainability program.
View All Articles