
📊 Surveys That Speak: Designing Evaluations That Truly Measure What Matters
👋 Introduction
Surveys are the bread and butter of higher ed assessment—until they aren’t. When students and faculty eye-roll at yet another link in their inbox, response rates plummet, and data quality nosedives. This week, we’ll explore how to design surveys that are valid, reliable, and actually worth answering—capturing the pulse of engagement, belonging, and satisfaction without causing survey fatigue.
💡 Best Practices & Tips
| Key Area | Practical Moves | Common Pitfalls |
|---|---|---|
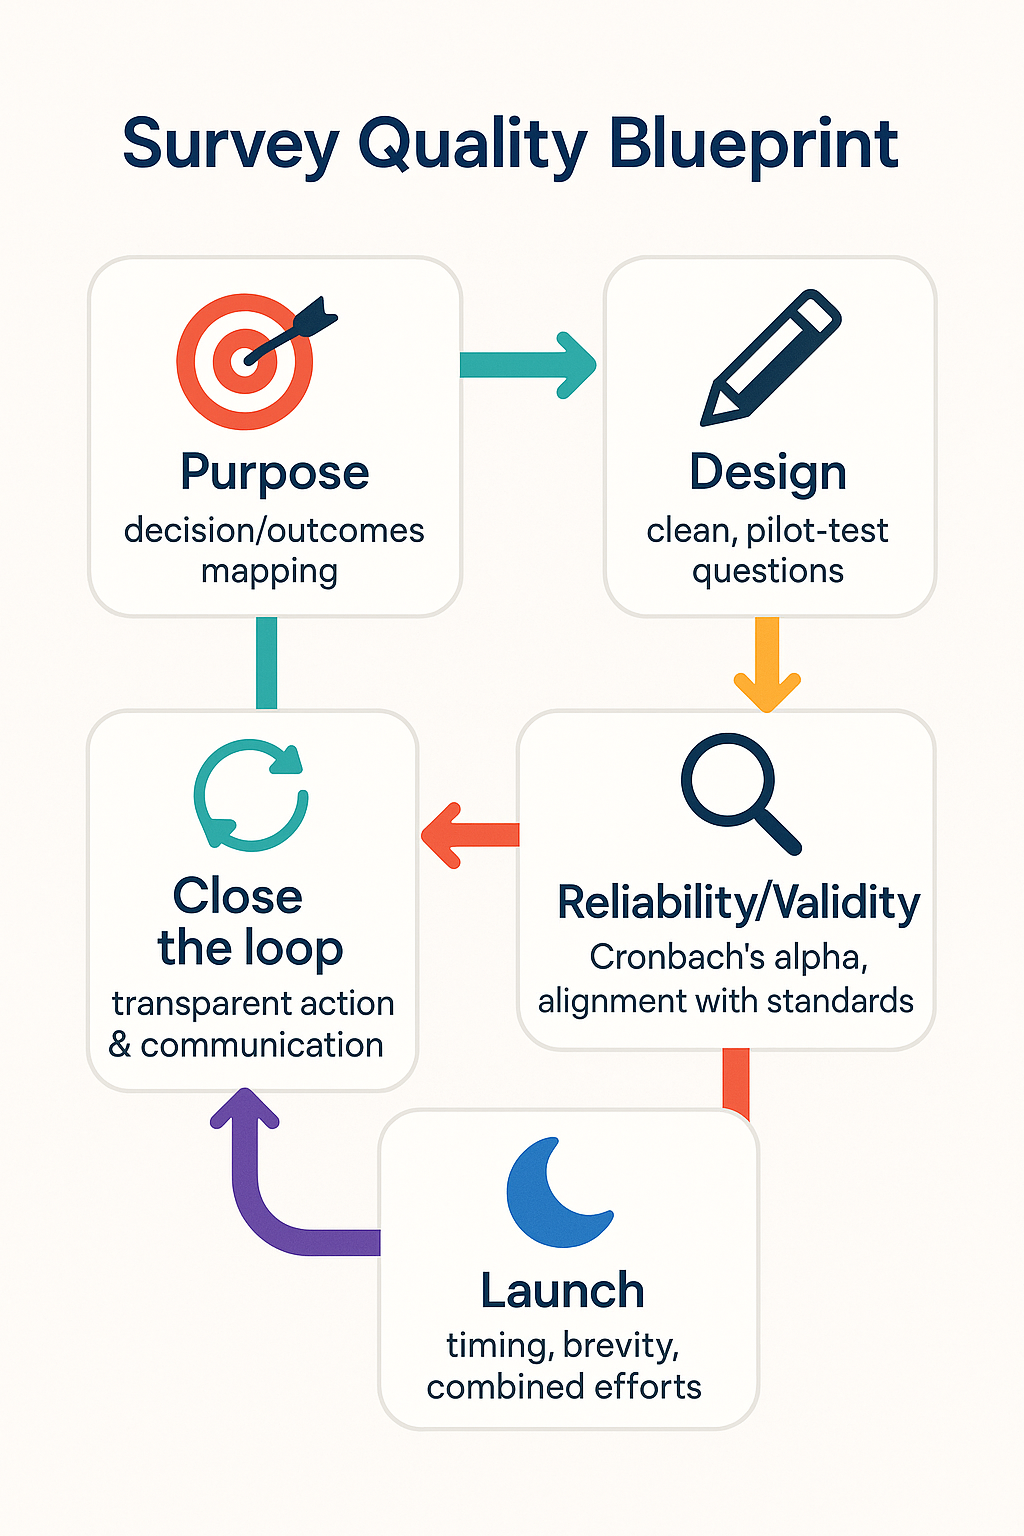
| 1️⃣ Start with a clear purpose 🎯 | – Define exactly what decisions the survey will inform (e.g., program redesign, retention strategy). – Link every question to a learning or operational outcome. | – “Let’s just see what people think” → leads to bloated, unfocused surveys. |
| 2️⃣ Craft powerful, clean questions ✏️ | – Use plain language and one idea per question. – Prefer scales that are balanced and labeled (e.g., Strongly Disagree → Strongly Agree). – Pilot with a small group first. | – Double-barreled questions (“How satisfied are you with advising and career services?”). – Overuse of open-ended questions that nobody codes. |
| 3️⃣ Build validity and reliability in from the start 🔍 | – Align with recognized frameworks like AERA/APA standards or established student engagement measures (e.g., NSSE-style items). – Use Cronbach’s alpha or split-half tests for reliability. | – Testing reliability after distribution—when it’s too late to revise. |
| 4️⃣ Fight survey fatigue 💤 | – Keep completion time under 10 minutes. – Combine related efforts into one well-structured instrument. – Time launches thoughtfully (not finals week). | – Sending multiple long surveys in a single term. |
| 5️⃣ Close the feedback loop 🔁 | – Share key results and the actions you’ll take. (“You said X, we’re doing Y.”) – Highlight quick wins in newsletters or department meetings. | – Silent results that vanish into a data black hole. |
💡 Quick win: Create a “Question Map” table with three columns: Question, Outcome it informs, and Decision to be made. If any question can’t fill all three columns, cut it.
🏫 Example/Case Illustration
A large urban university faced survey fatigue: the student engagement survey response rate had dropped below 20%. An assessment team overhauled the process:
- Purpose refinement: They identified three core decision areas—curriculum, advising, and campus life—and removed 40% of questions unrelated to these outcomes.
- Reliability check: Using a pilot sample, they ran Cronbach’s alpha, ensuring internal consistency above 0.8 for key scales.
- Strategic launch: They combined the engagement and belonging surveys into a single 8-minute instrument and rolled it out mid-semester, when inboxes were lighter.
- Closing the loop: A month later, they published a simple infographic showing “You said… We did…” changes (e.g., more evening tutoring hours).
Within a year, response rates jumped to 55%, and campus stakeholders reported greater trust in survey results.
🧭 Closing
Great surveys are short, sharp, and actionable. By defining purpose up front, testing for validity and reliability, and respecting the respondent’s time, institutions can turn surveys from dreaded chores into trusted decision-making tools.
Remember: every question must earn its place. Data that doesn’t drive action is just digital clutter. When you share results transparently—“You said, we did”—you not only improve response rates but also strengthen campus trust and culture.
👉 Next week: We’ll kick off a fresh cycle with High-Impact Practices—exploring innovative ways to integrate global experiences, research, and service-learning into programs that excite both students and faculty.
❓ Question of the Week
What’s one survey on your campus that needs a radical spring cleaning—and what question would you cut first to sharpen its focus?
Dr. Alaa Alsarhan is a higher education leader and analytics expert specializing in assessment, learning outcomes, and data-informed decision-making. He is CEO & Co-Founder of Horizons Analytics, a consultancy advancing AI-powered assessment and strategic planning in education and business. Dr. Alsarhan has authored multiple publications, delivered national keynotes, and led innovative research on high-impact practices, student success, and AI in higher education. He is a founding member of the GenAI in Higher Education Assessment Community of Practice and a fellow with the NWCCU Mission Fulfillment and Sustainability program.
View All Articles